- Sensor system and data acquisition
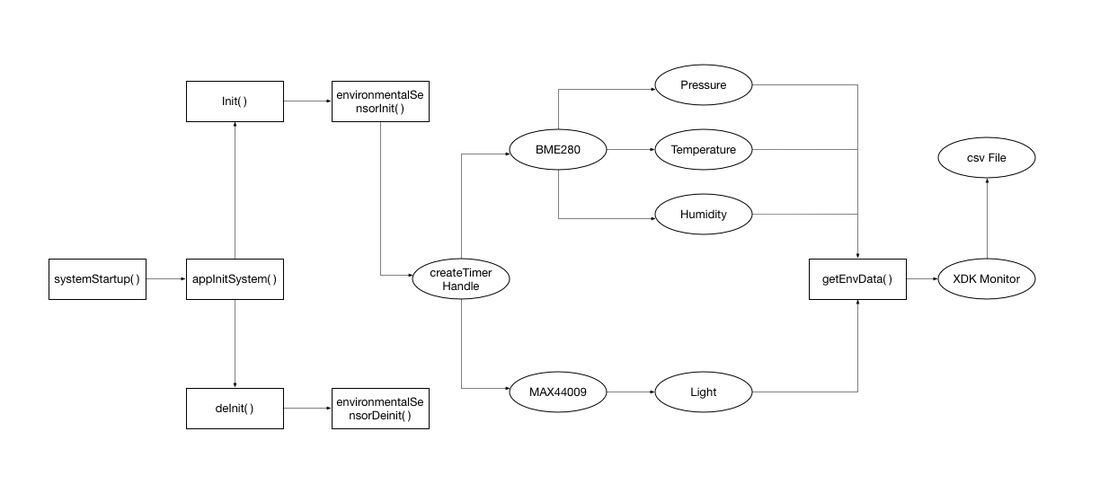
In this part, Bosch XDK provides us template about the project. Below shows the structure of the template:
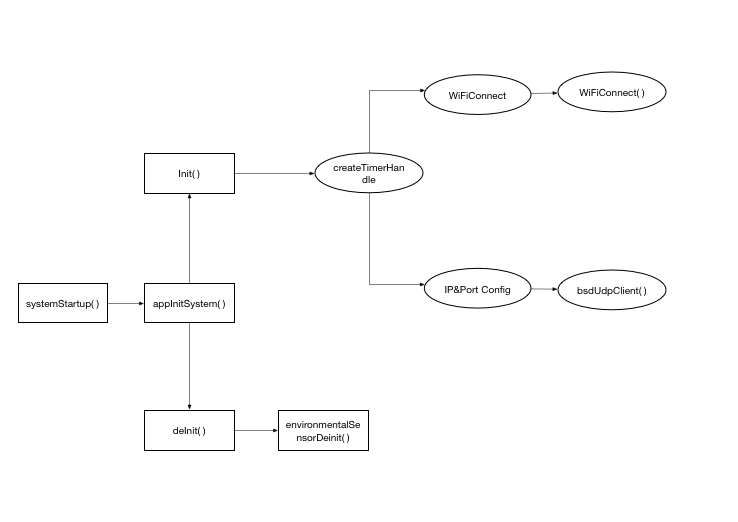
we give out the passing sensor data from usb and the networking program structure.
we give out the passing sensor data from usb and the networking program structure.
- Cloud&Internet
We employed DynamoDB from AWS to store the data, in this section, we use two pipes to do this:
1. First version, skip the configuration of the windows operating system and just communicate between the windows and a mac, send the gathered data to mac, then send to dynamoDB, in this case, mac behaves like a router. Also, this allows data transmission between different computers.
2. Second version, more simple, after we found configuration of boto on windows was not that hard, we could send directly to the dynamoDB.
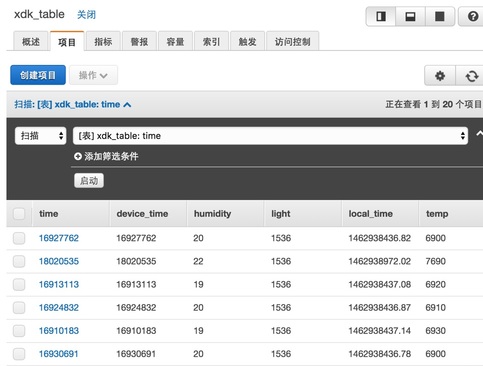
- Data Collection
- Data Visualization
- Data Analysis
How to get those timestamps:
Open door: the value of light sensor increases suddenly
Close door: the value of light sensor decreases suddenly
Humidity peak: after closing the door, the first peak value of humidity sensor
Humidity recover: the timestamp that the value of humidity sensor keep stable for some time after peak value.
Temperature peak: after closing the door, the first peak value of temperature sensor
Temperature recover: the timestamp that the value of temperature sensor keep stable for some time after peak value.
Having those timestamps, we can calculate the refrigeration time of each fridge and get the period of time that each fridge needs to decrease the temperature by 1 degree. Then we can compare the refrigeration property of two fridges.
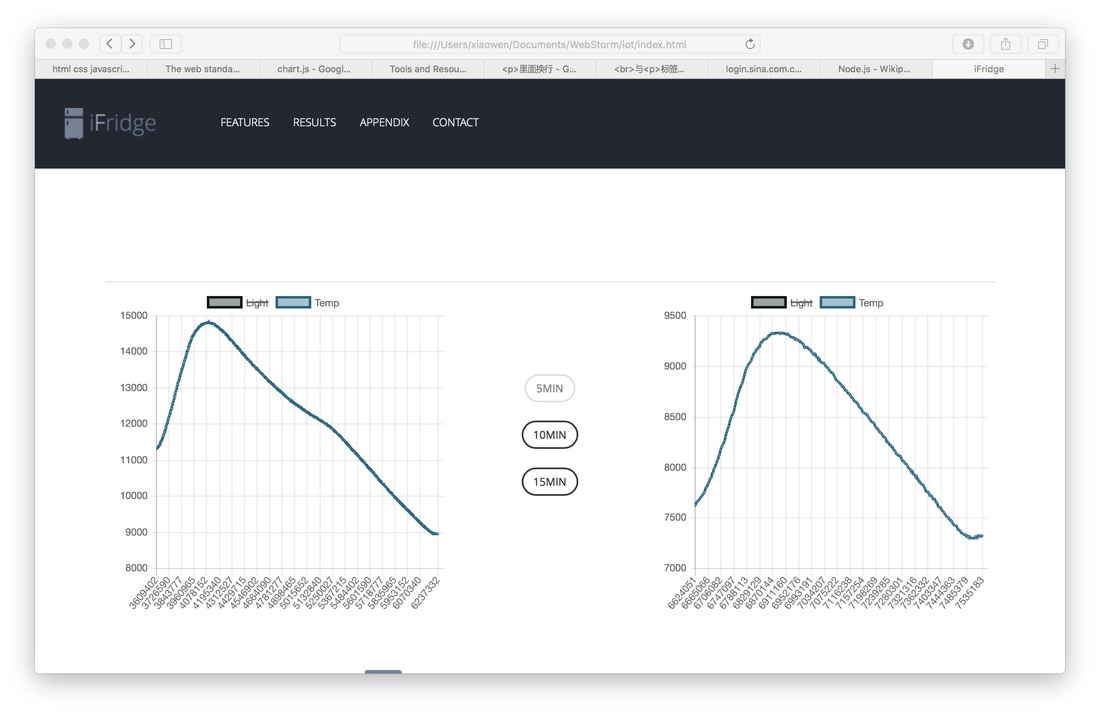
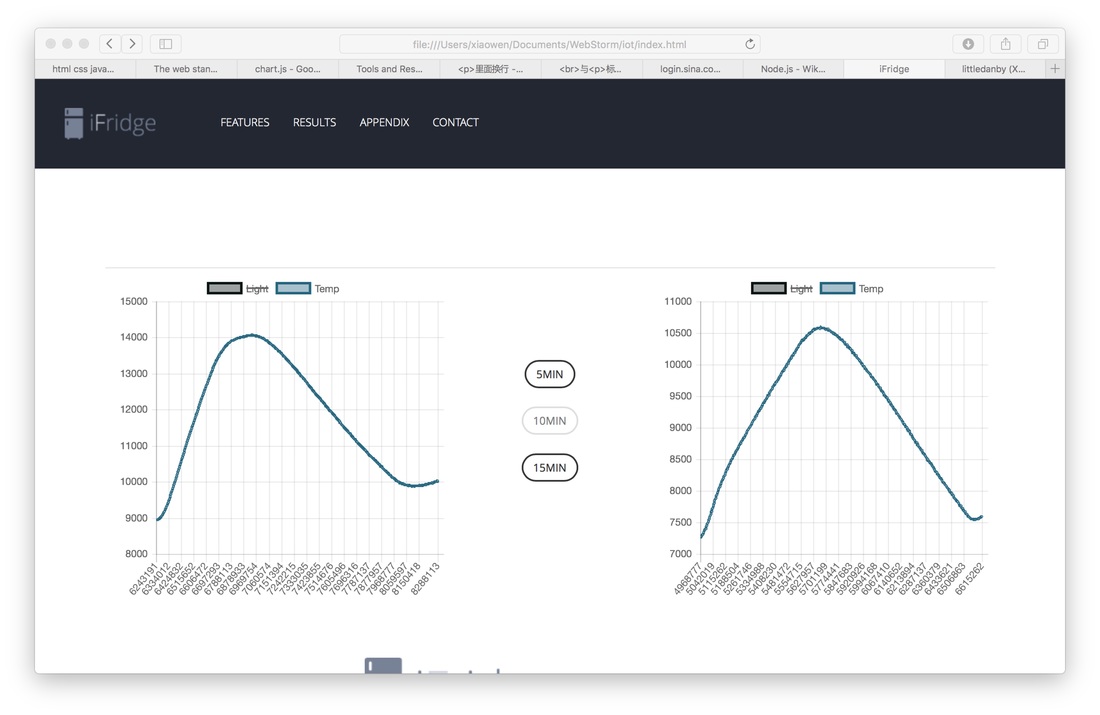
Temperature curve graph of fridge 1 and fridge 2 for 5 minutes
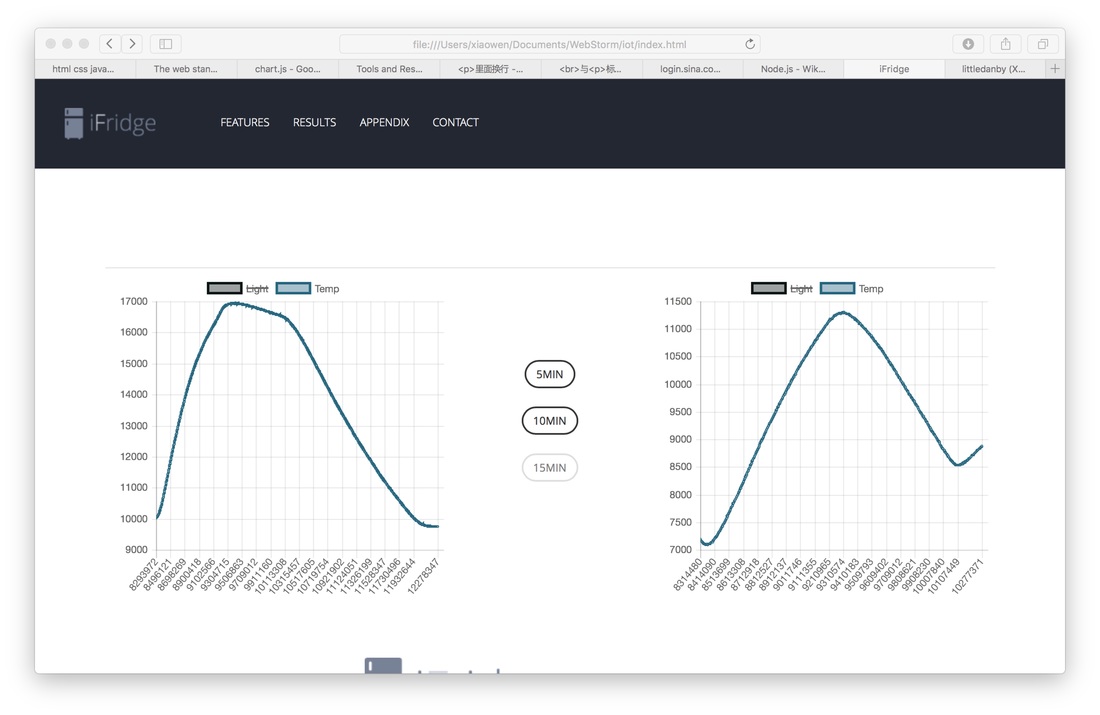
Temperature curve graph of fridge 1 and fridge 2 for 10 minutes
Temperature curve graph of fridge 1 and fridge 2 for 15 minutes
Using data in above graphs, we can calculate time for fridge 1 and fridge 2 to use to decrease inside temperature by 1 centigrade.
Here is the result. The table shows that for each time interval, how much time(ms) will fridge 1 and fridge 2 use to decrease the temperature by 1 centigrade.
Here is the result. The table shows that for each time interval, how much time(ms) will fridge 1 and fridge 2 use to decrease the temperature by 1 centigrade.
Fridge/time |
5 min |
10 min |
15 min |
Fridge 1 |
370.46 |
334.93 |
415.31 |
Fridge 2 |
312.01 |
314.45 |
397.60 |
